
In this article, we will be looking into what is a burndown chart and from where we can access them in JIRA.
Topics covered: #
- What is burndown chart
- Benefits of burndown chart
- How to use and read burndown charts
- How to create and navigate burndown charts in JIRA
Let us start with what is a burndown chart and why is it so popular in the scrum world followed by its usage and navigation in JIRA.
What is the burndown chart? #
Sprint burndown charts are the charts to track how much work remains in the sprint for each uncompleted task/story. Burndown charts provide a graphical representation of work pending versus the time frame left in the sprint to complete it.
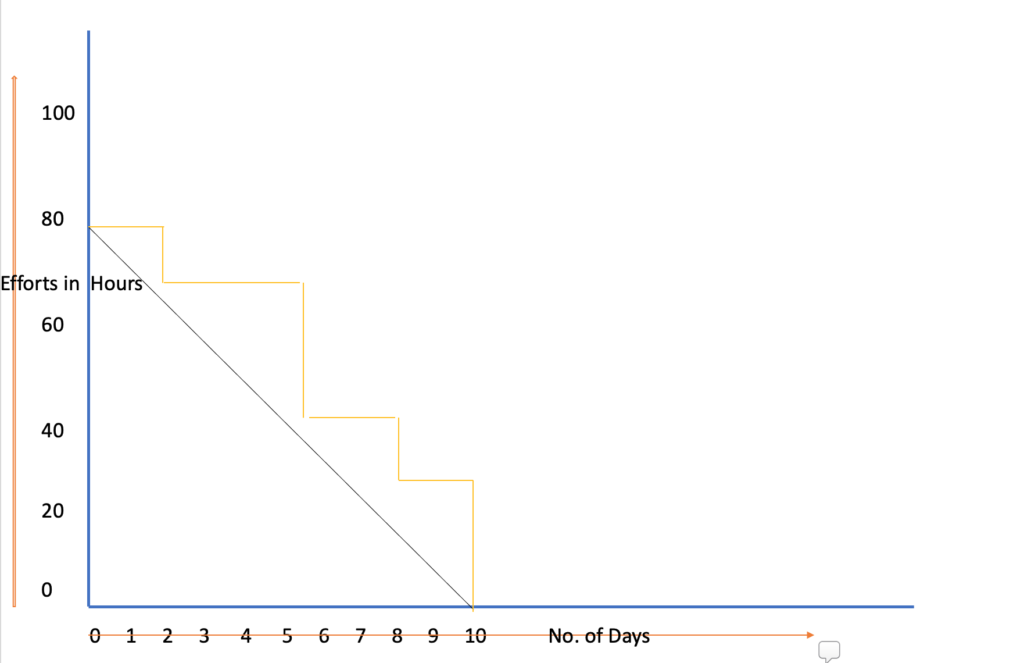
Sprint burndown where effort is estimated in hours.
The benefits of using the burndown chart #
Burndown chart is a smart graphical way to know how much work is left and how much time is left to complete it.
If we think a bit more, there could have been other ways to get this information; for example, we could have used tables or text. All the other options become tedious when the team’s size is slightly larger like teams with, let’s say, 8 to 10 members and the sprint is of more than one week.
Let us compare the burndown chart with a table to showcase the information. Below is an example of burndown rate shown day by day in the form of table (figure1. burn down rate table) as well as in the form of the burndown chart (figure2. burn down chart).
There are 10 tasks in the sprint and the sprint duration is 10 days.
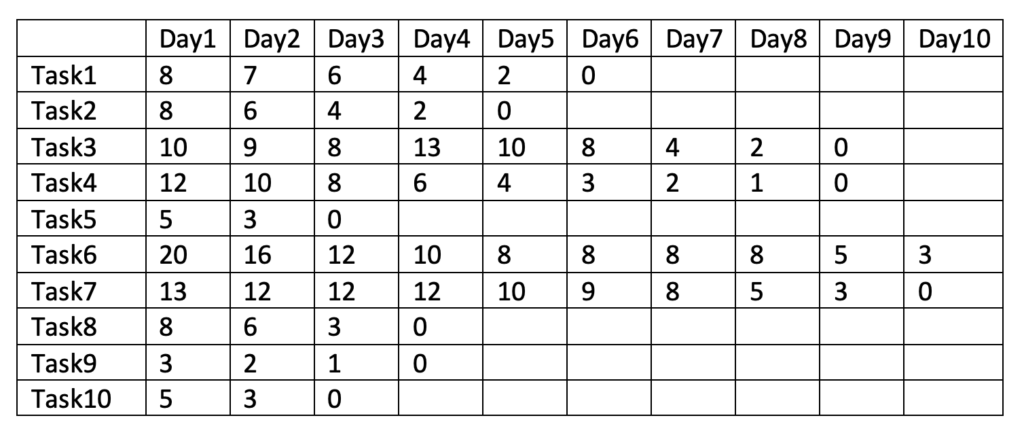
figure1. burn down rate table
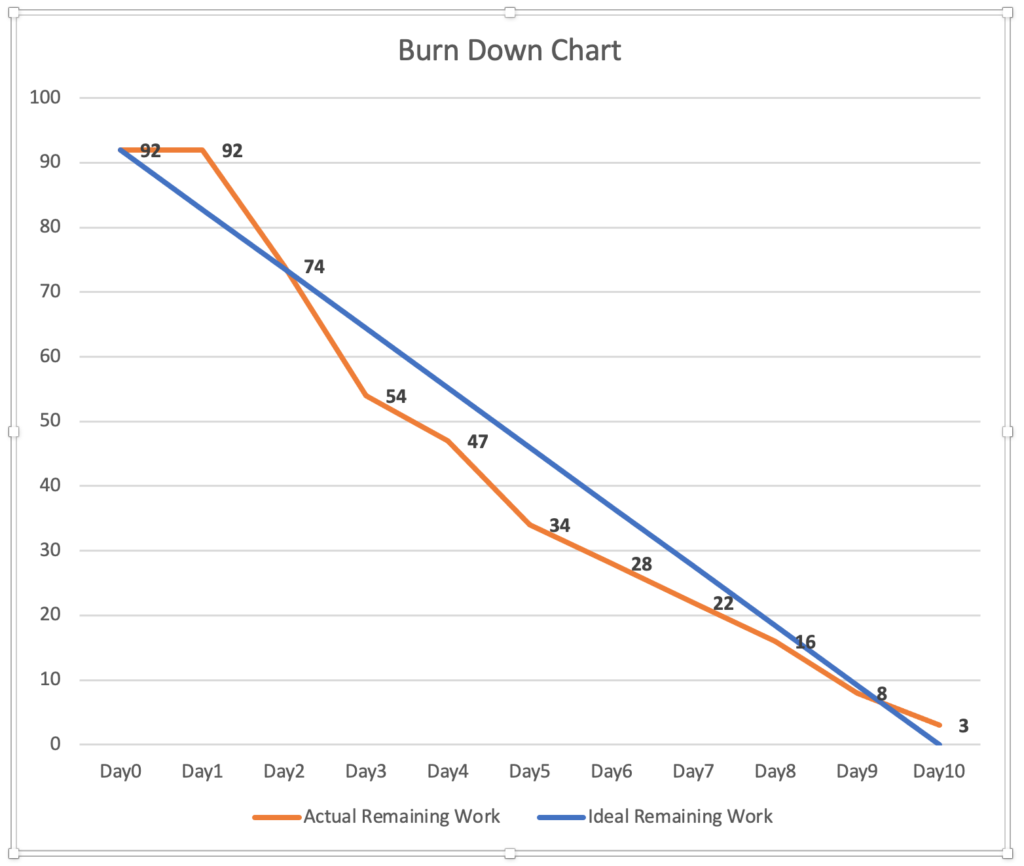
figure2. burndown chart
As we can see, the chart provides an easy way to refer to the remaining work each day.
Burndown charts help the team to see:
Usage of burndown chart within the sprint #
- If they are lagging.
- If any of the tasks requires a longer time than expected and estimated.
- If any task/story needs additional external help.
- If there is any scope creep.
The team observes the burndown chart every day and can resolve their risk satisfactorily before they become problems.
Usage of burndown chart in multiple sprints #
On observing burndown charts for multiple sprints, we can also get an insight into any issues or opportunities for the project.
- If the team consistently completes the work before time, it means the team is not pulling enough work in the sprint.
- If the team is always lagging, it indicates that the team brings more work than the team can do in a sprint.
- If charts are consistently showing sharp drops, it means that team is not dividing the work appropriately.
How to use and read sprint burndown charts? #
It is straightforward to read and interpret burn down charts. Before moving forward, please re-look into the figure2. burndown chart as we will be referring to it.
X-axis - Timeline of the sprint, generally in days (refer figure2. burndown chart)
Y-axis – Effort, generally in hours or story points (refer figure2. burndown chart)
Ideal Remaining Work Line (blue colour) - This shows the perfect path when burning the daily effort. Therefore this line starts from the total(maximum) effort on day0 and by the last day, the effort remaining is 0.
Actual Remaining Work Line (orange colour)– This shows what happened or happens when the team is actually burning the efforts. If we see the above example, the orange line starts with a total(maximum) effort on day 0, but some effort is still pending by the last day. (figure2. burndown chart , t_his is just one of the examples)_
If the Actual Remaining Work Line is above the ideal line, it means the team is behind schedule, but if the Actual Remaining Work Line is below the ideal line, it means that the team is ahead of schedule.
How to create and navigate the burndown chart in JIRA #
JIRA, as always, provides an environment so that it is easier to work with in Agile. Jira software will create the burndown chart by default if you are using it in sprints. The prerequisite to creating burndown charts is to have all your stories and tasks estimated before starting the sprint.
To view the sprint burndown chart in JIRA.
Step 1: Click the Reports option from the left-hand side menu in JIRA.
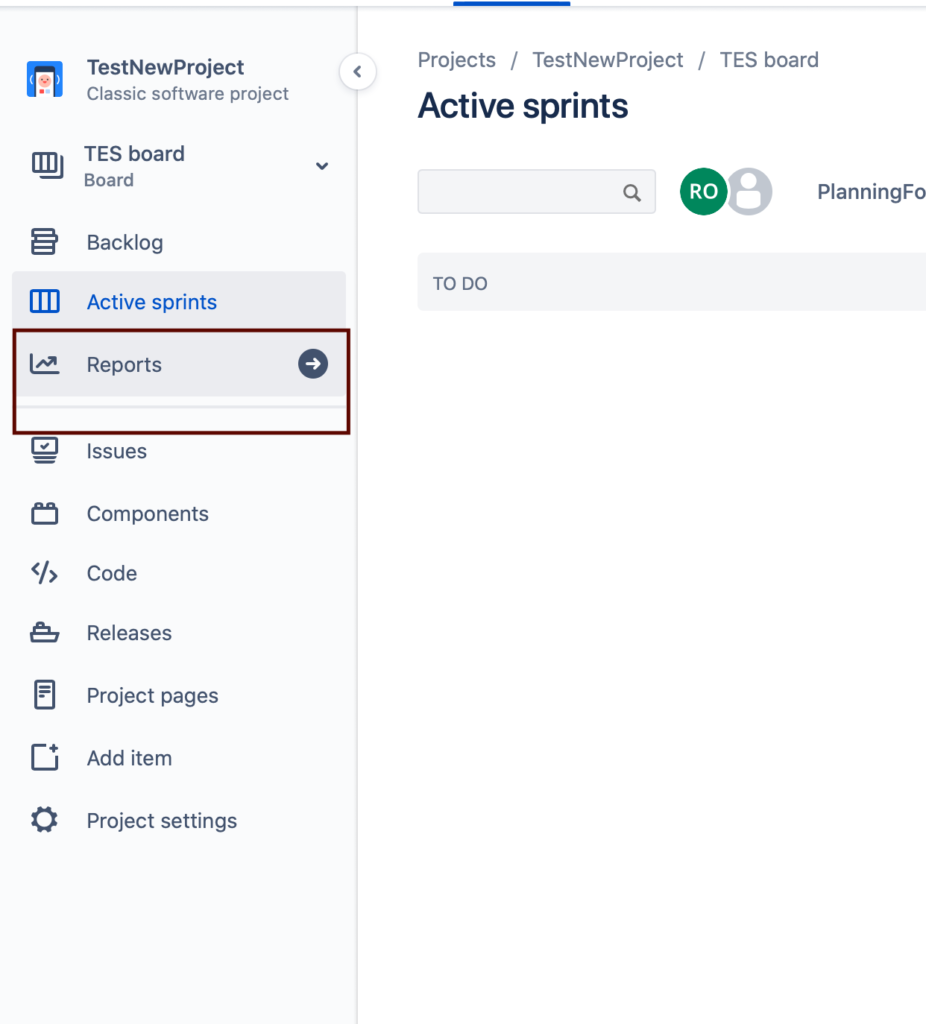
Left Menu- JIRA - Reports
Step2: Click the option Burndown Chart
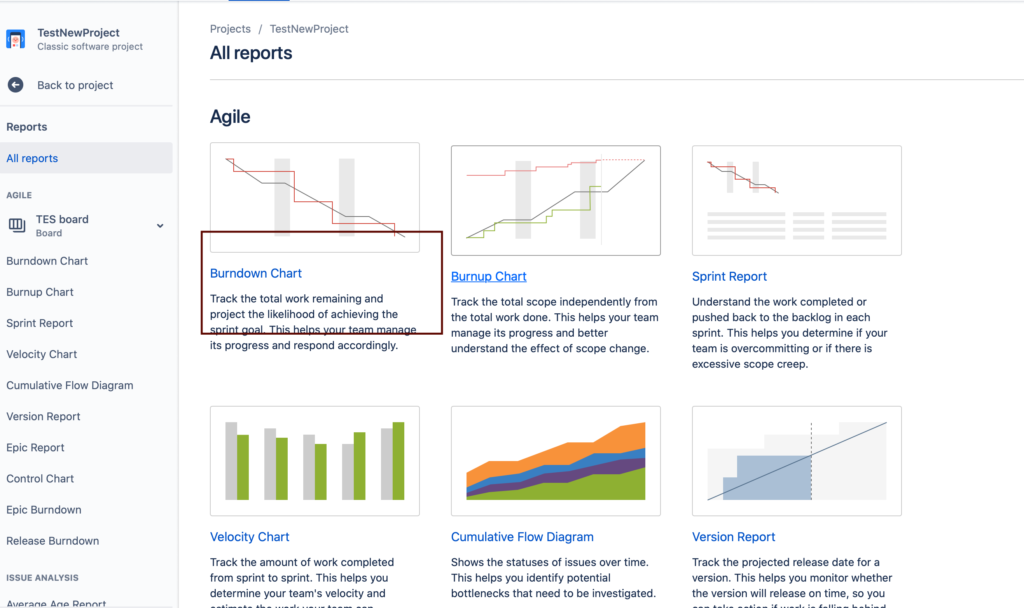
JIRA - All Reports
Step3: Select the option using which you want to create/view the burndown, such as story points or original time estimates.
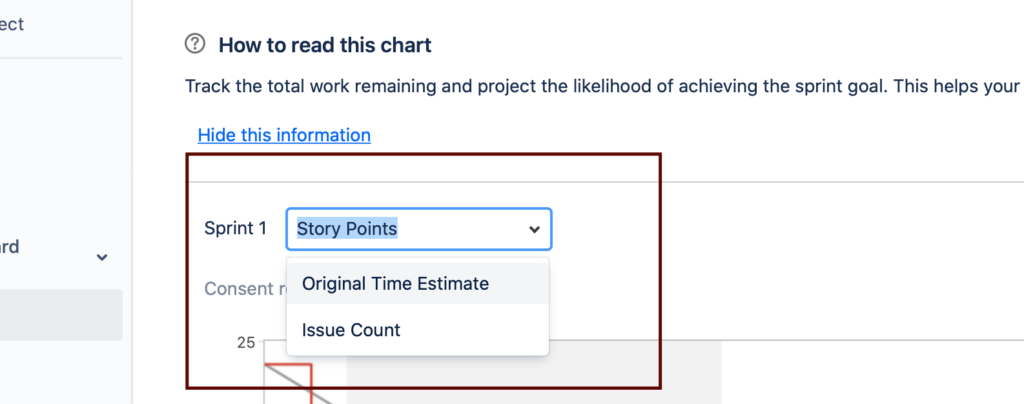
JIRA burndown story points
Once the above selection is made, we can see the burndown chart as shown below ( Burndown chart created with story points as estimates).
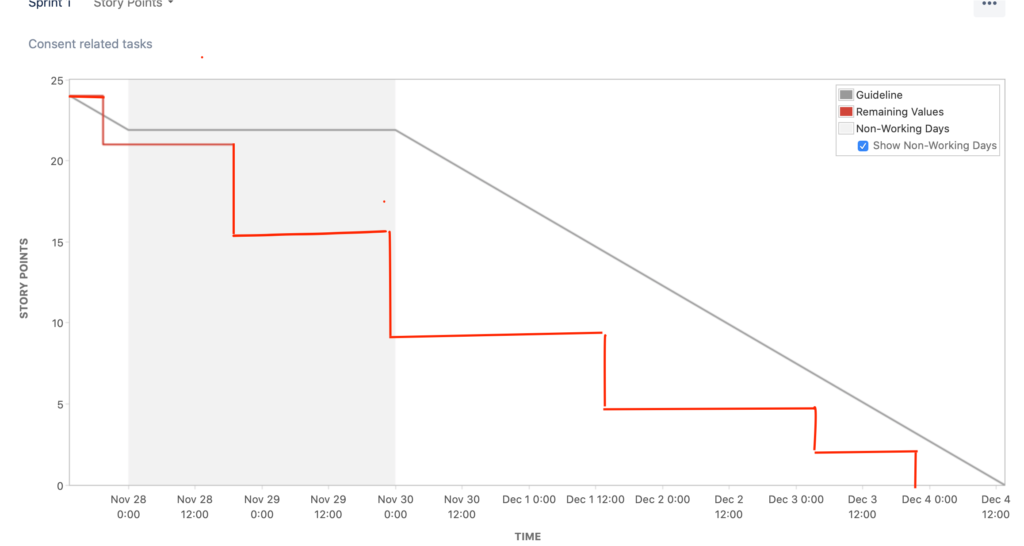
JIRA-burndown-chart
Burndown charts are one of the most potent and useful charts in sprints, referred by the team every day to ensure they are progressing in the right way.
I hope this article helped you to have a good understanding of burndown charts wish you all the best for your next sprint.