
This article will talk about what velocity is in agile, its importance, velocity charts, and more..
video tutorial on velocity in agile
Velocity is the measure of work done by the team in a time-boxed interval. In other words, velocity is the amount of work done or the PBIs (Product Backlog Items) completed in a sprint. This work can be measured in various ways through hours, story points, user stories, etc.
In sprint teams, while measuring velocity, we do not include the sprint items that were worked upon but somehow could not be completed or delivered. Only those stories will be eligible for velocity calculation, which were delivered.
PRO TIP : Velocity is the measurement of output and not the outcome of an iteration.
There is no means by which you can compare the velocities across teams. Velocity depends on numerous factors like the team’s size, duration of the sprint, product the team is working on, the organization’s environment, knowledge of the team members, specialization of the team members, and many more. Hence it is counterproductive to compare the velocities among teams.
Importance of Velocity in Agile #
Velocity is an integral part of the agile world and plays a vital role in planning and consistent improvement.
Planning:
Velocity is essential for planning purposes of either a scrum or a release. While doing sprint planning, the team is aware of the velocity they can deliver in a sprint. Hence while planning for the next sprint, the team understands how much work they can pull. Mature teams never pull stories with story points significantly higher than they have been delivering in the past.
Velocity is crucial in doing release planning in agile-based projects. The team divides the size of the release by the average velocity of a team and calculates how many iterations the team will require to complete the release work.
Continuous Improvement:
Velocity also helps in indicating to the team how they are performing. Measuring velocity over time allows the team to visualize how they are doing in terms of performance. Velocity can also be considered a signal if they need any internal/external help concerning skills or any other aspects. Velocity also helps the team to develop an optimal sustainable pace.
Agile Velocity Calculation #
Let us now see how to calculate the velocity. The velocity is calculated by averaging out the work done in different iterations.
Few points to be considered while calculating the velocity #
- If a team is new and has less understanding of the product to be delivered, then the team should take some time to stabilize and build some data before coming up with their velocity.
- If the team is immature, consider the story points delivered in at least three to four iterations to develop a team’s velocity.
- If the team is mature, even two iterations are enough to calculate their velocity.
Example of velocity calculation for a team #
We will be calculating velocity for a team suppose TEAM-A who does estimations in story points. The below table 1.1 shows the story points delivered in each sprint.
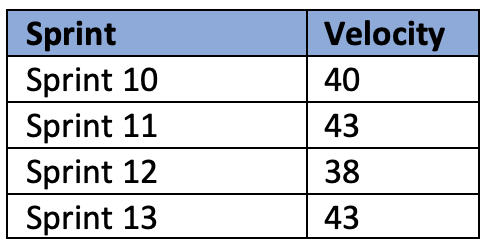
velocity over a few sprints for Team-A
Now, let us calculate the velocity of Team-A
Formula : Sum of the velocity of all the iterations divided by the number of iterations.
Therefore, the velocity of Team-A will be 41 ((40+43+38+43)/4 )
Agile Velocity Chart #
Velocity chart is an effective way to measure the team’s progress and get a glance of how the team is performing. It provides a way to view how the team has been doing overtime. The main element of velocity is commitment vs delivery. How many story points have been committed while planning an iteration and how many story points were actually delivered.
Velocity chart helps the team view if they are heading in the right direction and if they have been doing the estimations and assumptions correctly over time.
The table 1.1 shows the velocity of a team over five sprints, followed by their velocity chart.
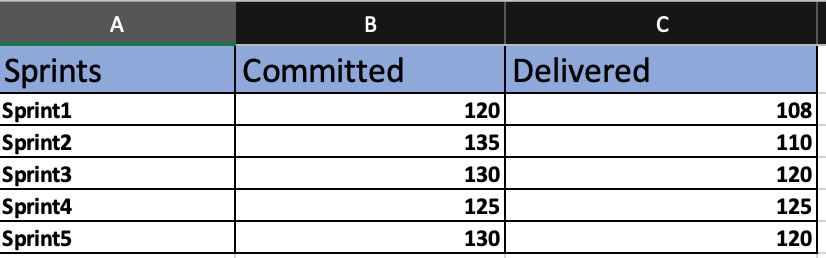
table 1.1
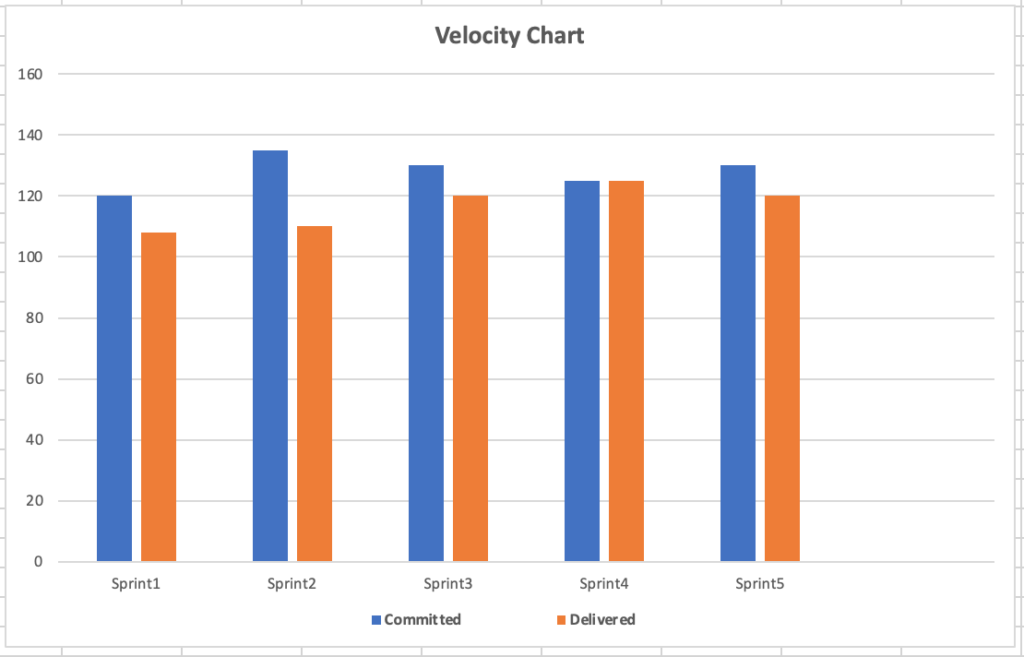
velocity_chart
The chart shows the story points which were committed by the team (blue bar) while sprint planning vs. the story points delivered (orange bar) at the end of each sprint.
If we read this chart, it does not show much variation in commitment vs. reality; neither are there many variations in each sprint’s velocity. Therefore, this chart shows that the team is progressing well and is doing good in estimations and assumptions.
Summary #
To conclude, I would say that velocity is a straightforward but potent means for measuring a team’s rate and helping them become consistently efficient. Do not overcomplicate velocity by trying to compare it across teams.
Though the team should gradually improve their velocity, it is unrealistic to expect a rise in velocity by every iteration.
Thank you for reading this article. I hope this article provides a good understanding of the velocity concept in agile. Good Luck !!